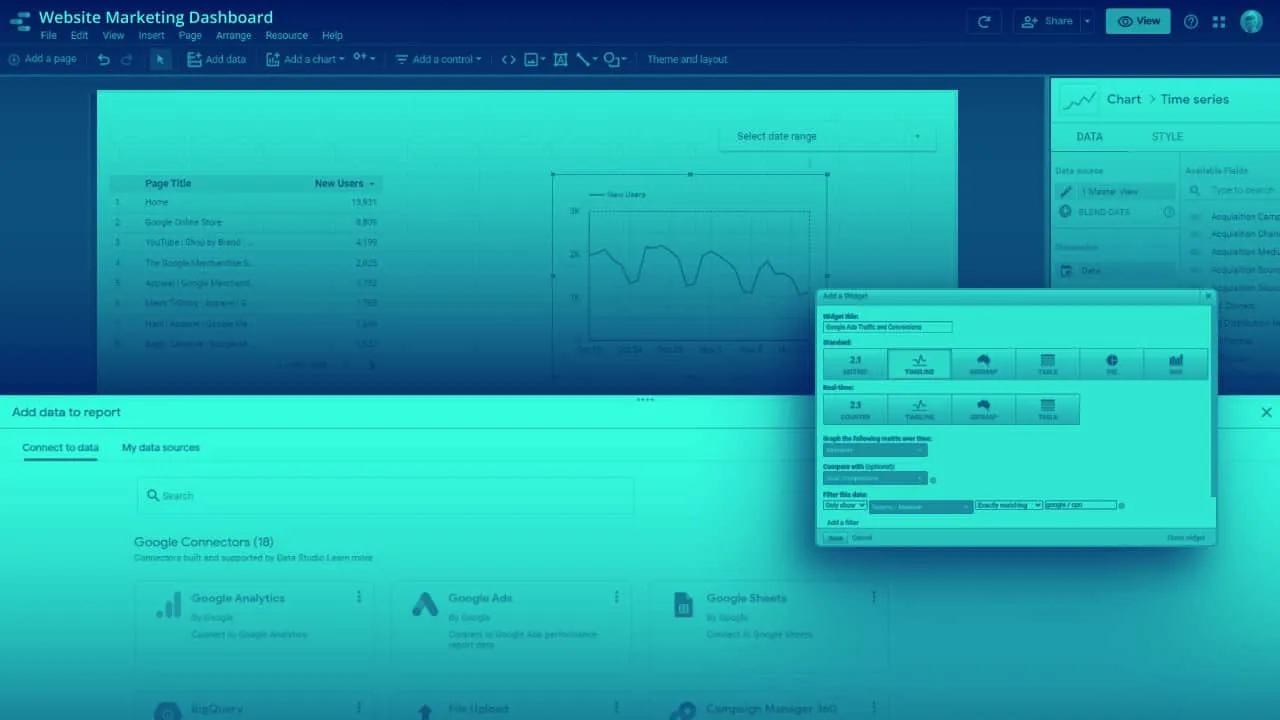

Google Analytics and Google Data Studio are great and free tools for tracking what is happening on your website, allowing you to gather data, perform data analysis to gain insights, and present them through reports and dashboards to your coworkers, your supervisor, or your client. A proper report structure will not only save you a lot of time but also allow you to see the trends and insights you wouldn’t find otherwise.
Let’s take a closer look at best practices on how to use Google Analytics and Google Data Studio to achieve these goals.
How to create a Google Analytics dashboard
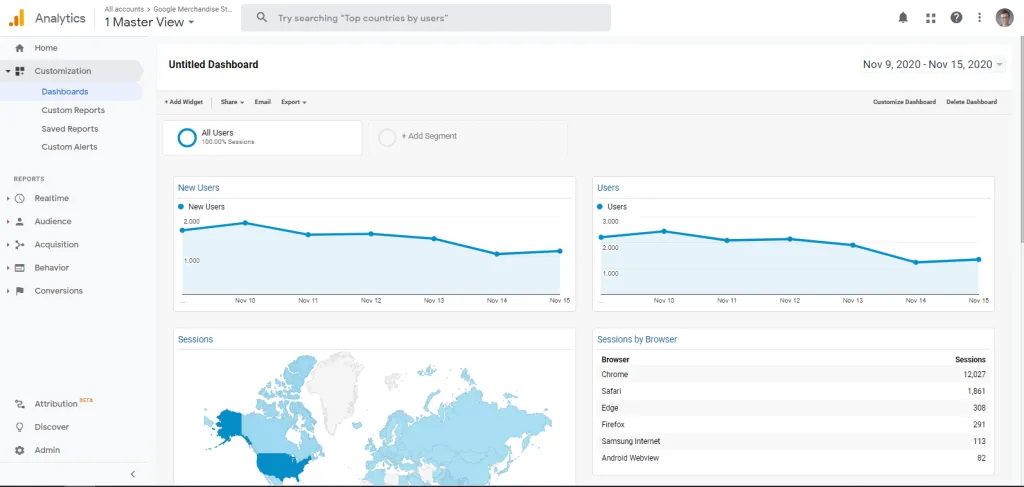
First, let’s start with what we can do with Google Analytics’ native tools. When you open the account you’ll see a standard dashboard with basic information about your website (or mobile app). A number of users and sessions, main channels, real-time active users, locations, etc.
However, not all of them will be interesting for everyone. An SEO specialist may be interested in organic traffic only. A content specialist will like to see recent blog posts results. A marketing manager wants to see general conversion trends. So instead of one dashboard for everyone or jumping through multiple sections to gather all of the information you can create a dashboard with all the information you want to see. To do that go to Customization -> Dashboards and click on “Create”.
Here you can create the report from scratch or look through Google Analytics Solution Gallery and import one of the pre-made dashboard templates to your Google Analytics account.
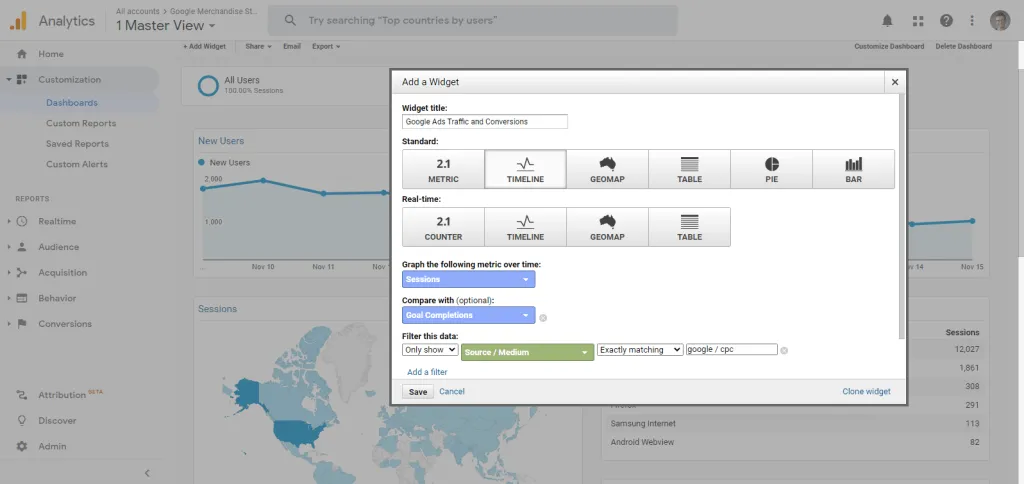
If you’ll decide to create a report from the beginning all you need to do is to add widgets with the data you want to see. Creating widgets is very simple and this is the biggest disadvantage and advantage of Google Analytics dashboards. It has only a few steps:
Type a widget title, for example: “Google Ads Traffic and Conversions”.
Choose the visualization type from 6 different possibilities (4 of them works in real-time), in this case, we’ll use a timeline.
Choose the metric you want to see. We’ll choose a Sessions and Goal Completions.
Choose filters. I will go with “source / medium” exactly matching “Google / cpc” to see only Google Ads traffic.
Link to the existing report in Google Analytics. If you’d like to see more details about this traffic paste the page you’ll see after clicking on the widget. I will use a Google Ads report when I will be able to see more data if needed.
And that’s it. A few more cool features are:
Segments – you can see only chosen segments like in any other Google Analytics dashboard and all your widgets will be adjusted to that. For example “Mobile Traffic only”.
Layout options – basically here you can choose how many columns do you want to have in your report.
Email – you can send an e-mail to yourself (or any other person) every day or every week and if the dashboard contains all the info you need – you don’t have to visit the GA website at all. A big time-saver.
However, as you may know, this is just the tip of an iceberg and you can do much more with Google Data Studio, so let’s see.
Why use Google Data Studio
It can help you not only with Google Analytics data but with many others including Google Ads, Google Sheets, Facebook Ads, Twitter Ads, Google BigQuery, etc. and you can visualize all of this information in one report.
And visualizations besides pie charts and tables include also radar charts, Gantt or candlestick charts, and many more ways you can share your data with others. You can even use free templates made by other users and fill them with your data. All of that with your own theme and user options like filters or data controls. I think it’s enough reasons to be familiar with the tool. If data is the new oil, Google Data Studio is an efficient engine made to power your business decisions.
How to work with Google Data Studio
Let’s go through step by step instruction and the most important features of the tool.
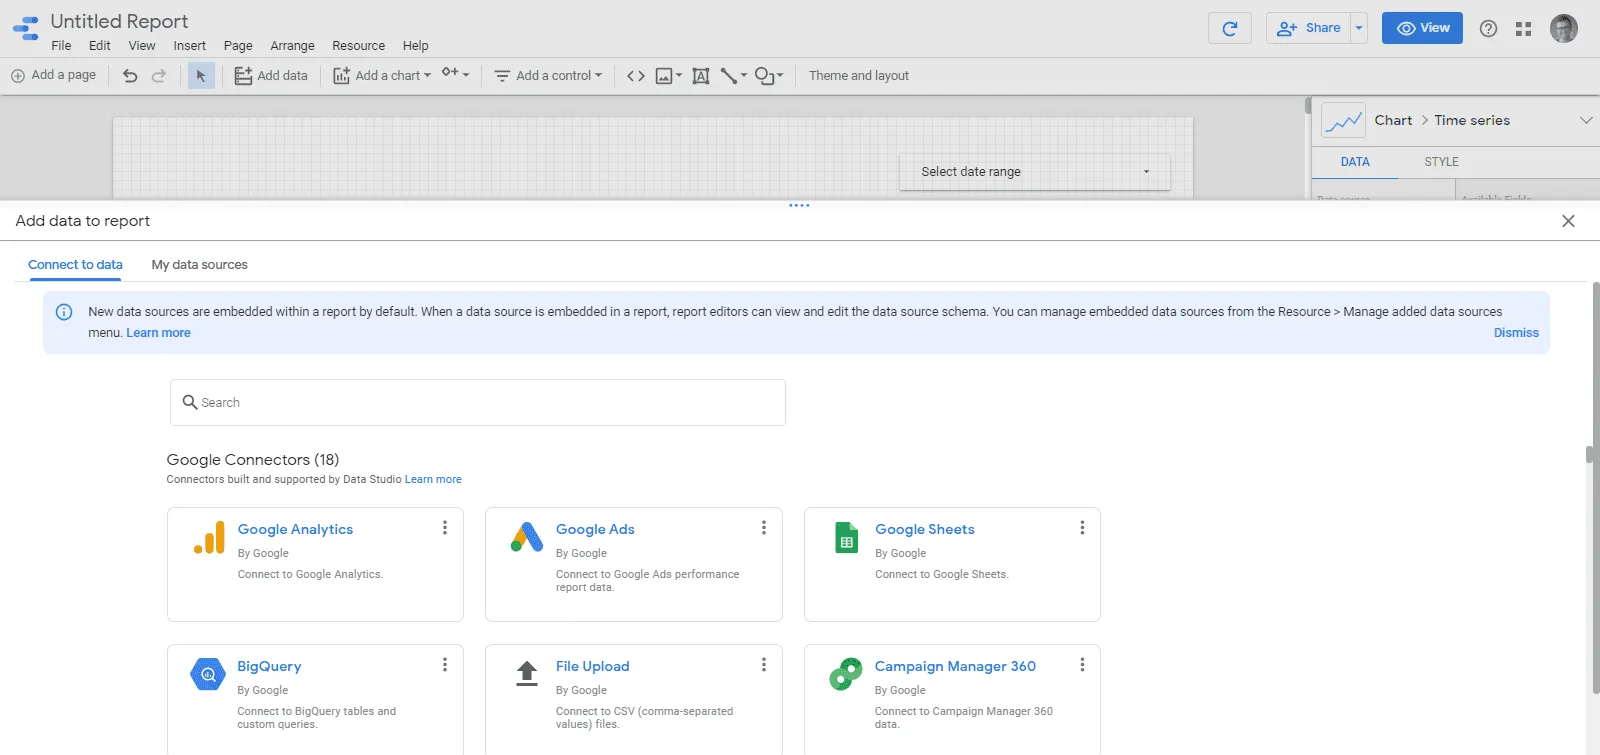
1. Connect to data
Use a data connector from over 300 possible platforms like Google Ads, Facebook Ads, Ahrefs, Linkedin, Mailchimp, etc. It will make your data available for Google Data Studio reports. And of course, you can use more than one. You need to authorize your decision, and in some cases put some more details (for example which Google Analytics view you want to use).
You will be asked for that immediately when you’ll create a new report so just follow the instruction If you’d like to add more data sources click on “Add Data” in the top toolbar.
2. Set up report settings
It’s an optional step but before you start you can also customize your theme, grid, or use a configuration for all of the data in reports like one filter for all tables. To do that you can use the File – Report Settings menu or View button (also in the top menu).
3. Insert a chart
Now you can add a chart, graph, map, or any other visual representation of data from your data source. To do that just click on “Insert” and choose one of the many possible visualization options available and click and drag anywhere in your report to create a chart and establish its size.
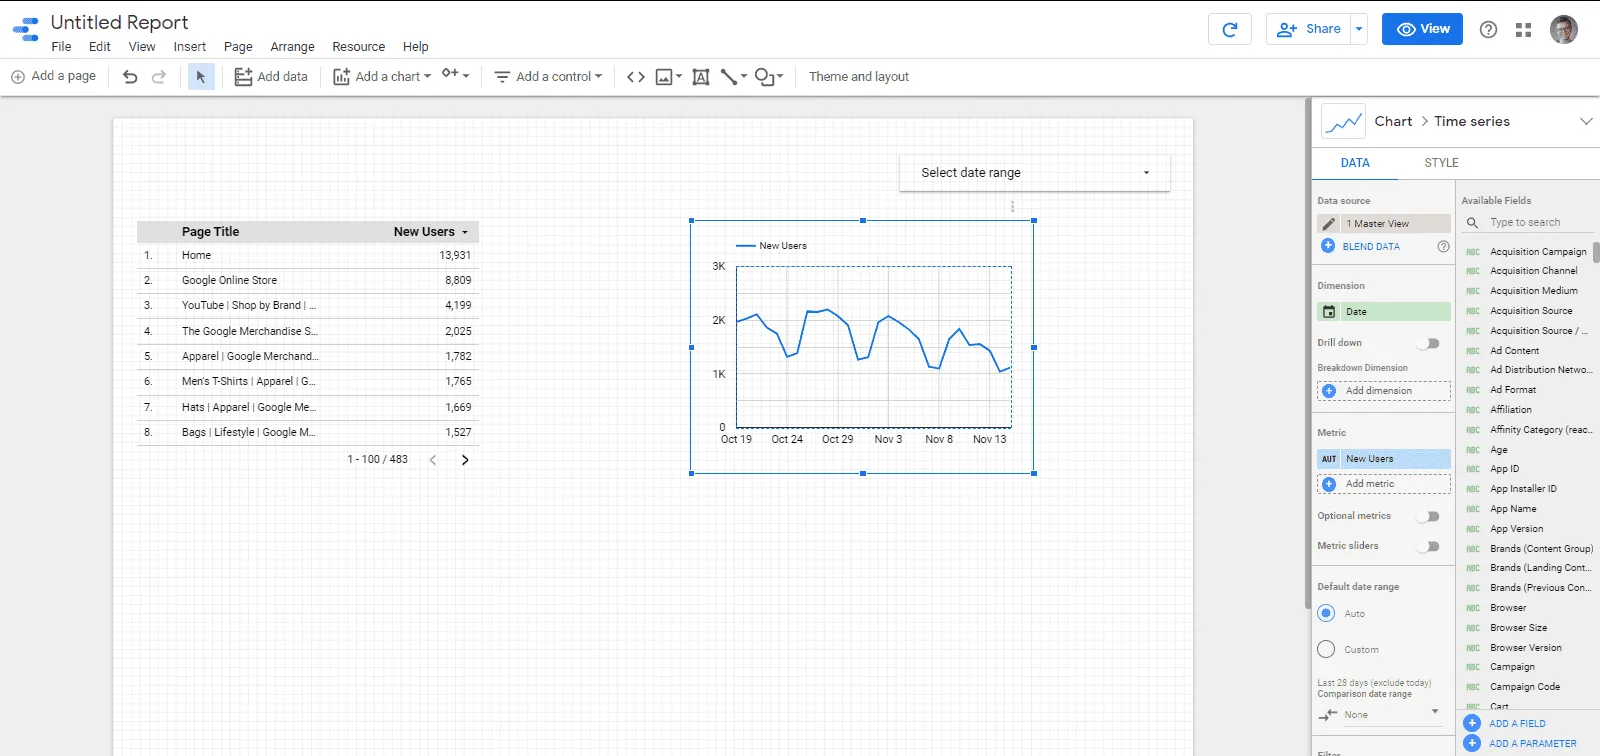
4. Edit your data
Now you’ll see the sidebar with a few additional options. You can choose or change the data source of your chart. Pick dimensions and metrics to be seen and filter your data to show only a segment you need right now. For example traffic from a blog or one country only.
5. Style your data
Edit the look of your chart (also in sidebar) by choosing colors, backgrounds, font types and size, legends, axis, and basically any other option you want.
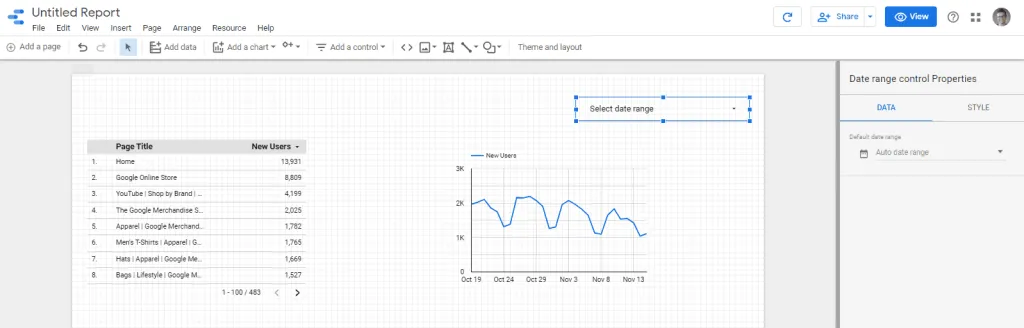
6. Add a control
You can make fixed charts and show the users the same data all the time but you can also allow them to use some filters like data filter, dropdown filter, or checkbox. Typically it’s best to put them in the top-right corner.
And that’s it. Your first report is ready. Now you can add more data connectors, more charts, and even more pages to your report. We’ve covered the basics, and now I’ll describe a few little more advanced features.
Google Data Studio – Advanced Features
1. Blend your data
You can merge two data connectors into one like two tables using SQL but it’s much simpler here. For example, you want to find out in which city your sales is the best, you have a report with sales per city and you also have population data from Wikipedia in your google sheet. Using the “Blend Data” button in your report you can merge these two datasets together.
After you’ve created a chart or a table, click the “Blend Data” button in the sidebar, choose the 2nd data connector and select the join key. The key is the data field which will be the same for both of your datasets. In this case: a city. Then you can add more dimensions from both of your sources and save the report.
2. Use Google Sheets
Even if there are more than 300 connectors for Google Data Studio, from time to time you’ll want to work with some data not available for instant connection. If there’s a way to automatically put these data in Google Sheets or CSV (and a CSV file to Google Sheets) – that will save you. If not – you can try with an external tool like Supermetrics.
Supermetrics is excellent for gathering data from other sources and preparing the data for Google Data Studio. Using Supermetrics you can add one additional step for your reporting and first download all the data for Google Sheets and refresh them regularly (for example once a day) and then import just these one Google Sheet to your Google Data Studio and create charts easily.
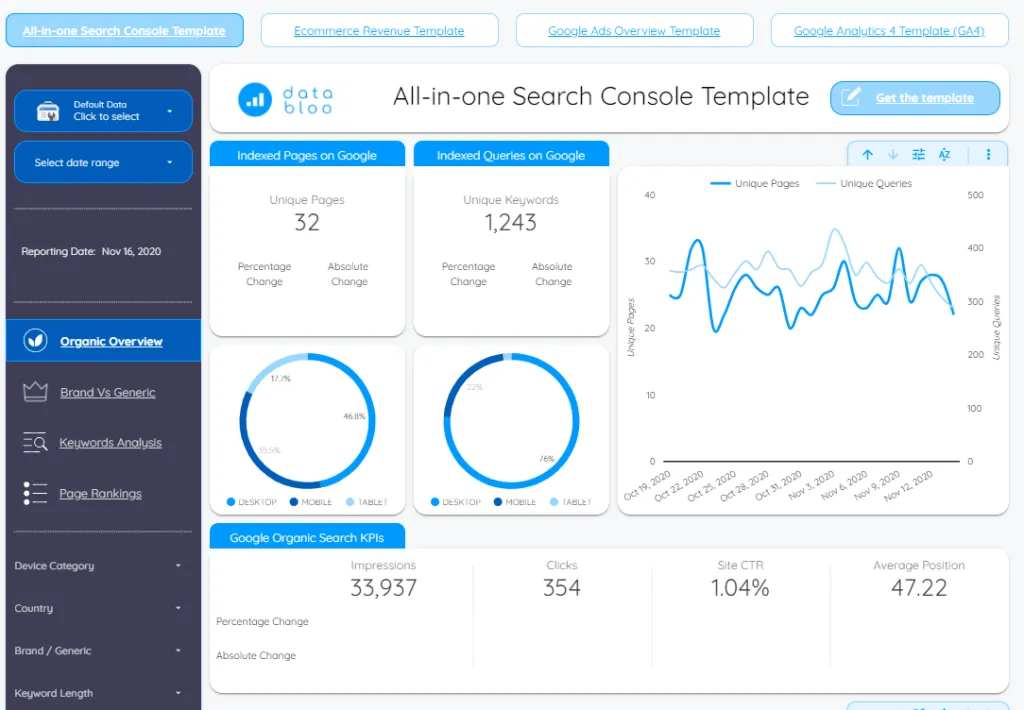
3. Use Reports Gallery
You can use community visualizations or even the whole report templates from the open templates gallery. Some business needs are similar for everyone or at least every business type so I’m sure you’ll find great reports that can save you time and inspire you for some creative solutions.
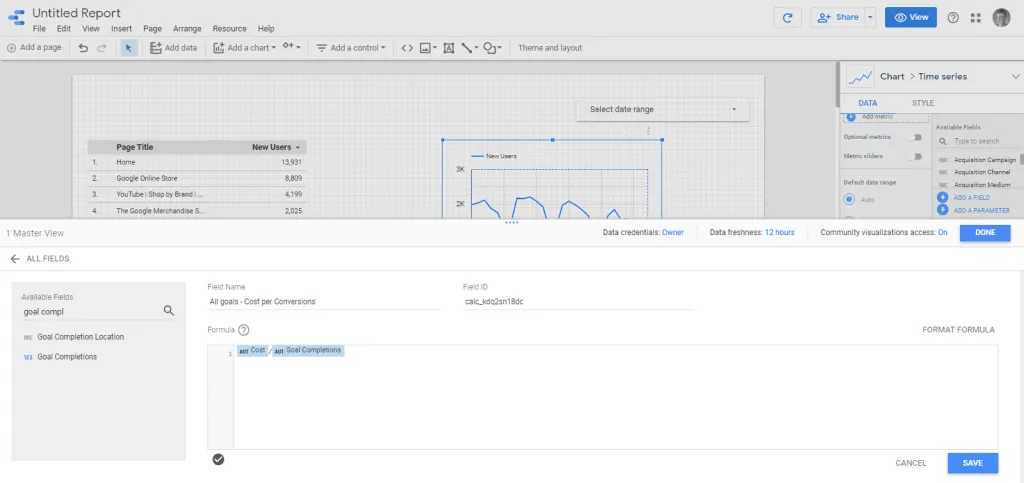
4. Use Calculated Fields
In your chart sidebar, you have a bunch of fields from your data connector you can use. Like Google Analytics dimensions. But if you want to, for example, sum up both of your conversions together or calculate a cost per conversion you can easily add a custom field. In the sidebar go to the bottom-left corner and click on “Add a field”. Name your field and create a formula, for example
Cost / ( Newsletter + Lead )
Which will show you the cost per Newsletter OR Lead.
Or: ( Lead * 1 ) + ( MQL * 4 ) + ( SQL * 8 )
Which will show you the dimension including the custom value of your leads.
5. Use RegExp filters
Whenever you create a filter for your report remember you can use Regular Expressions which will help you to filter out anything you want in one filter. Using RegExp filters you can make conditions based on adjacent characters, character orders, using OR expressions, etc. It’s extremely useful for detailed reporting.
For example, if you want to filter out your IP address and your employee traffic. Let’s say those IP addresses range from 198.51.100.1 – 198.51.100.25. Rather than enter 25 different IP addresses, you could create a regular expression like 198.51.100.d* that matches the entire range of addresses.
Data visualization: tips and tricks
In the last chapter, I will share a few tips on how to make your reports easy to use for your viewers. History knows a lot of cases when a potentially useful report was never opened because it was too complicated and not clear enough for users who often are not so familiar with data as the report creator.
1. Use descriptive headlines
It may sound obvious but make sure your titles, headlines, legends, and labels are visible, clear, and understandable for everyone. Include the data source if necessary and remember to inform about the filters and segments you’ve used. And including all of that, you don’t want the copy to dominate the report.
2. Don’t merge too many data points together
Google “worst charts ever” and you’ll easily find out what to avoid. Overcomplicated 3D animation with hundreds of series. The aim is to immediately understand the chart so if you have the feeling your visualization is not clear enough, try a different chart type, split it into more charts or just cut some data.
3. Use both axes in line charts
Users and bounce rates at the same data series? Possible, but only with separate axes, one with the number of users and one with the bounce rate percentage. And again, it has to be big enough for everyone to know immediately which side is for which series.
4. Remember about paddings and margins
There’s a temptation to include many graphs on the same page because they are all important and work great together! But to make the report clear we need to give them space to breathe like in web or graphic design so in this case usually, less is more.
5. Choose the right graph
There is a lot of resources for this topic so it’s impossible to cover the whole story here, but ask yourself a question of how many variables do you want to show. Lines is good for 1-2 series. Lines, bars, and columns can represent change over time, pie charts are good to display parts and proportions, and scatter plots are fine for transitions and lots of data visualization.
6. Use the intuitive color sets
Use red for positive and green for negative numbers and it will be a disaster ready. Besides that make sure there are not too many colors on your charts (6 is usually max), the contrast is high enough to recognize all of them, and if you use the color scale, remember all the colors have their connotations in your users’ heads. It can be also a good idea to highlight the data point you want to focus on but if you’ll highlight everything – you’ll end up highlighting nothing.
7. Cut, cut, cut
Delete everything that doesn’t support your story. When playing with so powerful tool like Google Data Studio it’s tempting to measure everything but for every business some metrics in there are useless. Put your data in the context, think about the goal you want to achieve and focus on that.
8. Include a zero baseline
These two charts present the same information.
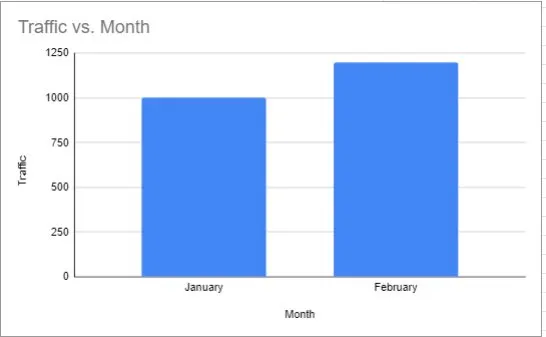
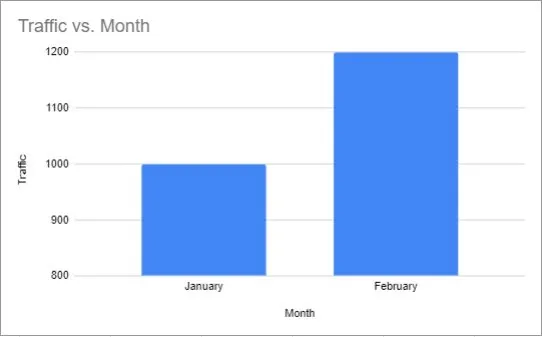
Do you see where the problem is? The real change is +20% but in one of them, it looks like +100% until you read the labels. It’s a very nasty practice but you can see it everywhere in media, especially referring to politics. Definitely, something to avoid.
Bonus: How to track visitors in Google Data Studio
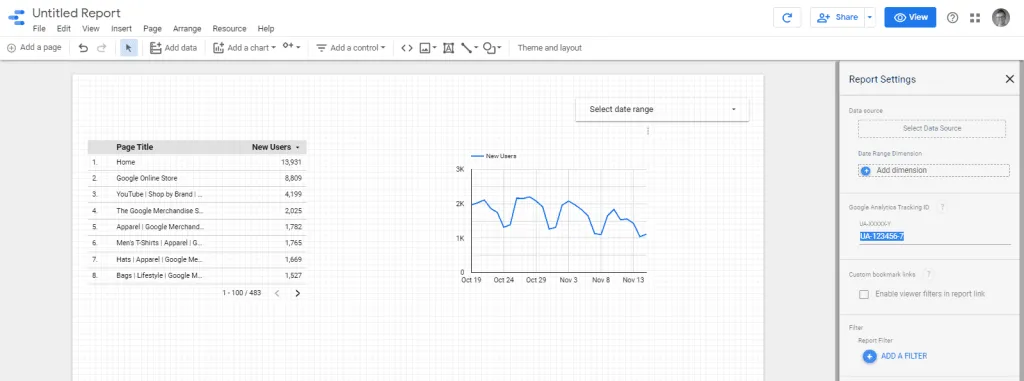
You can get your data from Google Analytics to Google Data Studio but you can also track your Google Data Studio traffic with Google Analytics. Google Data Studio page is a regular website and you can add it to your GA.
The best practice is to create a completely new Google Analytics account so you won’t mix your dashboard traffic with your main domain traffic. Once you do that go to the Report Settings and enter your Google Analytics tracking ID and that’s it. You’ll see the data in your Analytics.
Why do that? You can create a unique report as part of your content marketing activities, publish it, and promote it. You can even create an audience of your report viewers and retarget them later. It may be something for you to consider instead of the next blog post.
I hope the article was useful for you and I wish you high conversion rates!
Read more: