

Whether we like it or not, Google tools have become a standard in marketing and web development. Lots of them are free, intuitive, and available globally. That’s why in this article we’ll focus on AB testing inside Google Ads (using a native tool called Experiments) and using Google Optimize outside Google Ads.
What is AB testing
AB testing, known also as split testing or bucket testing, is a research methodology consisting of a randomized experiment to find out if our hypothesis is true or not. To put it simply, you divide your audience into two segments. One of them is a control group and for them, nothing is changed. The second one is an experimental group that sees different content, website, email, ad, or anything else you want to test.
AB tests take time and money and might be complicated to conduct but it’s the safest and more effective way of implementing changes. If you ever wondered why it takes so long to launch a new medicine or vaccine, one of the reasons is a requirement of a series of successful AB tests. But let’s get back to marketing.
Why AB tests
Make the right decisions
You might have strong intuition and knowledge about your products and users, but AB tests can give you and your team clarity about customer preferences. When you have the opportunity to support your decisions with data, why not to do it?
Improve constantly
Even if you improve your conversion rate by 5, it will have a great difference after a few iterations. Let’s say your conversions rate is 3% and you did 20 tests during the year and only half of them increased your CR.
| Test | Initial CR | Improvement | New CR |
|---|---|---|---|
| Test1 | 3% | 5% | 3.15% |
| Test2 | 3.15% | 5% | 3.31% |
| Test3 | 3.31% | 5% | 3.47% |
| Test4 | 3.47% | 5% | 3.65% |
| Test5 | 3.65% | 5% | 3.83% |
| Test6 | 3.83% | 5% | 4.02% |
| Test7 | 4.02% | 5% | 4.22% |
| Test8 | 4.22% | 5% | 4.43% |
| Test9 | 4.43% | 5% | 4.65% |
| Test10 | 4.65% | 5% | 4.89% |
At the end of this process, your conversion rate (and most likely your profits) increased by 63%. And if you did tests on every stage of the funnel from the first point of contact to upselling, conversion rates can be even higher.
We usually start with just a change in percentage points. And still, we began with only a few percentage change. While it might not be much, AB testing can help you to figure out its cause. For example, you could experience an improvement in conversion rates with just a different headline or some other, even smaller, change.
Implement in a safe-mode
As shown in the previous example, testing is a safe way for improvement. Even if your hypothesis is wrong, in the long term, the risks are low. You would just be losing out on many opportunities if you did not implement AB testing. Of course, in reality, testing has its costs as well, but it’s nothing compared to implementing changes without testing.
Furthermore, imagine a scenario where you implemented one of your ideas without testing and it decreased your conversion rate by 5 percent. It’s not only a step back for you. The worst thing is, you may never know about it and the negative impact will last for years until you realize something is wrong. In a constantly changing environment, it’s difficult to spot small changes. And small changes lasting long can make a big difference.
Learn along the way
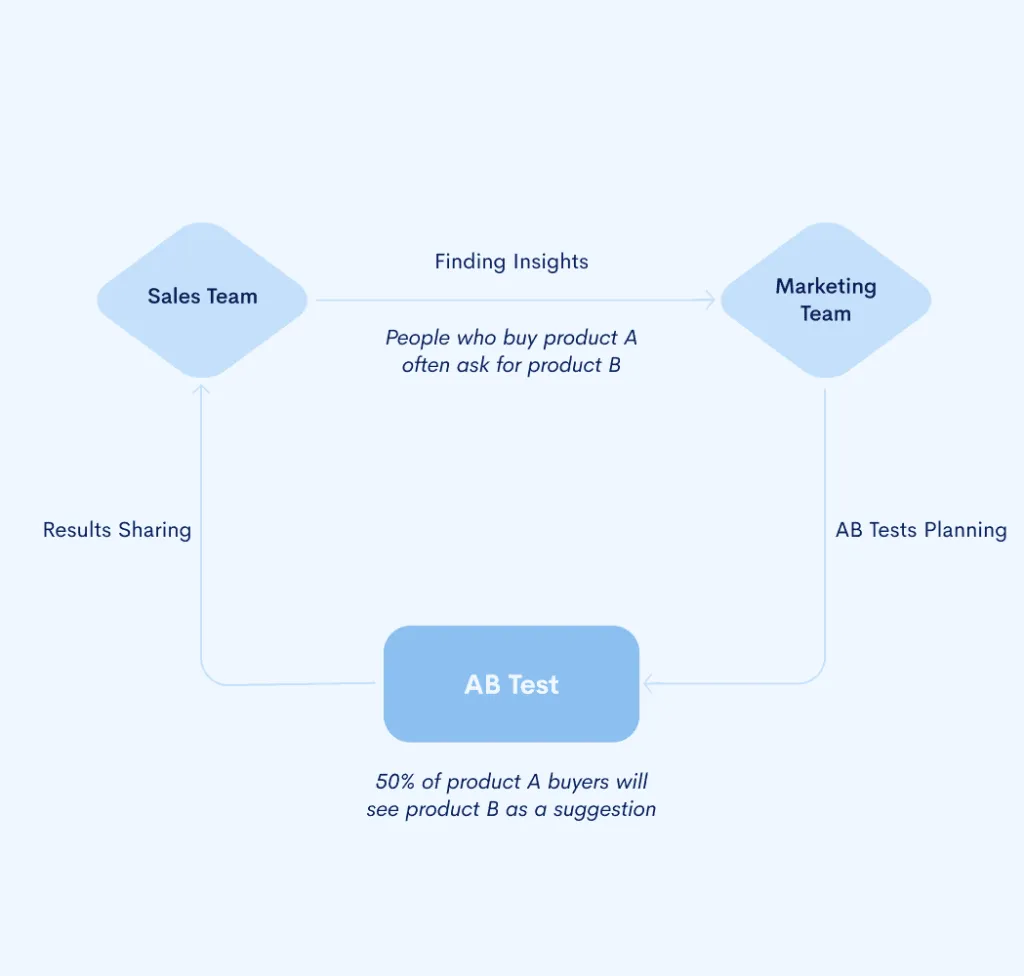
AB testing means gathering high-quality data and it allows you not only to improve your results but also to learn why you did (or did not) improve. You can test your hypothesis and then spread the knowledge across the organization. A common example is an exchange of knowledge between the sales/customer service and marketing/product departments.
When you’re on the front line and you talk to the clients you have a great opportunity to gather insights, learn about customers’ problems, objections, “aha” moments, and see how your users react to your communication.
From a research perspective: unique and qualitative data.
However, it may be hard for you to gather quantitative data because most likely you don’t have the time and possibility to perform thousands of conversations, ask the same questions to everyone, and note down your results. But you can pass your ideas to the people who create content and communication in your marketing campaigns or inside your product and they can see which of these ideas really work on a big scale.
Then, they will share the results of the tests back to you and you can use them in your work.
What to test
A common misconception is that AB testing is mainly conducted on your website and some online resources claim it is that straightforward. But there are many other marketing activities that you can AB test.
Ad creatives (graphics, videos, texts)
Landing pages (headlines, social proof elements, forms)
Emails (CTAs, titles, or even whole email sequences)
Product changes (dashboards, navigation, variants)
Sounds like you can and should test more! But in reality, equally important is to know when not to test and usually, the answer is:
When you need to have a consistent experience for everyone (i.e. pricing page)
When you don’t have enough data (niche products and campaigns)
When you can’t measure the impact or the impact is complicated, delayed, or too small to notice (For example, if you change your guarantee from two to three years it will take at least three years to see the first results)
How to plan an AB test
There are a few factors that need to be taken into consideration before starting the test. It may be tempting to treat careful planning as a waste of time. The test will last some time so one likes to start as soon as possible. But the more time you spend on planning the better results you’ll have.
Priority
If you have written down ideas on what to improve in your marketing funnel, you need to decide what to do first. There are many ways to answer it, one of the common frameworks is the ICE model. It has three variables.
Importance –how important is the testing element? How much can it improve the general result? How many users are affected by this element?
Confidence – how sure are you that the idea is going to work compared to the control version? How much evidence do you have? How many users suggested it?
Ease – how many hours will it take to achieve it? Do we need additional spending to produce it? Are there any other risks involved?
The product of these multipliers is the final value. The idea with the highest value should be the number one priority.
Time
When can we expect significant results? Do we have enough users to test this idea in a reasonable time? To calculate it, you can use another fancy acronym, which is a Minimum Detectable Effect (MDE).
Let’s say the existing conversion rate on your landing page is 10%. You expect your new landing page to have a 12% conversion rate. It means your MDE is 20% because 12% is 20% better than 10%. You need this estimation to predict how long your test needs to last. The higher your MDE is, the faster you will have the answer.
Other important factors are the number of users and the number of conversions for each version. Again, the higher, the better.
We will discuss more on measuring results later but for now it’s enough to remember that you need to prepare this information upfront and use one of the trustworthy online calculators like the one here: https://cxl.com/ab-test-calculator.
Run a pre-test analysis and check how much time do you need to run your test to get a significant result. Very often you’ll find there’s no point in testing some elements simply because you don’t have enough users or conversions to do it in a reasonable time.
For example, you’re testing a landing page and you have 200 users and 20 conversions weekly, so your conversion rate is 10%. To be sure in six weeks that your experiment version is a success it needs to have a conversion rate of 48.57% better, which in this case is around 15%. Spoiler alert: it’s a big improvement and often it’s hard to achieve it.
What if your experiment landing page improvement is less than that? It means you still can see the difference but it will take you longer to detect it. That’s why the MDE is so important.
| Criterium | Time Impact |
|---|---|
| Minimum Detectable Effect | Higher MDE = More Time Needed |
| Number of Users | More Users = Less Time Needed |
| Number of Conversions | More Conversions = Less Time Needed |
| Confidence Level | Higher Confidence Required = More Time Needed |
Testing environment
Even if all of our theoretical calculations are fair, we have to prepare for the unexpected.
As we mentioned before, most likely the tests will last for weeks and every change during this time can taint the results. So it is usually a good idea to talk to your coworkers and anyone who could be interested in the area you are testing and make sure no one plans anything there and you won’t get in each other’s way.
You can test different segments at the same time but only if one test doesn’t have any influence on the other. Plan ahead not only for your tests but also for other tests other people in your team might be doing. It may be very disappointing when in the middle of an important test of two different ads you need to interrupt it because you need to start with new Christmas communication no one told you before. 50% of a test is 0% of learning and profits.
What tools use for AB testing
There are many platforms that can help you with your tests. Most of them are designed to run an AB test on your website. Some of them can even help you with making changes on your website with some kind of visual editor.
Generally, you need:
a place to gather, write down and prioritize ideas,
tools to produce your experimental emails, ads or pages,
tool which will split your traffic into two (or more) groups,
a pre-test and after test results calculator.
As mentioned above, there are all-around tools that can help you with all of that. Here, we’ll go through this process using only Google tools.
How to interpret AB test results
We’ll talk about the most important concepts from the practical point of view. If you want to deep dive into the mathematics I recommend a Statistics and Probability course.
Every test result will beuncertain to some extent. Let’s say you flip a coin a hundred times and the success (or conversion) here is a tail. The real conversion rate is 50% and we know it. But will you get exactly 50 tails in your test? Probably no. You may get something like 55:45 or even some greater difference.
In this case, we know the real conversion rate is 50%, and if we’re far from 50% it means our sample size wasn’t big enough. But in your real test, you won’t know it so after 100 or 1,000 users you will have one variant winning, how to be sure it was not an accident?
That’s why we need to calculate its statistical significance, a measure which will tell us how sure we can be that the result we have is due to chance. The usual standard is 95% of confidence. Some use an even lower bar but even if you use a 95% level, it means that on average only 1 out of 20 times you will be implementing incorrect results.
Of course the higher the confidence level you demand to have for your tests, the longer you’ll have to wait to achieve results. To calculate your results, again, I recommend using the AB test results calculator.
There’s one more thing you can do to really feel how uncertain these results can be. Run A/A tests. Most likely you will see some difference after the first few days even if both variants will be exactly the same. It will help you to remember about randomness when you’ll feel tempted to end your test too quickly.
How to test in Google Ads
Let’s put this all together into practice. In Google Ads, you can test:
Bidding strategies (strongly recommend)
Ads & Extensions
Target Groups
etc.
When you test bigger things you have a bigger impact on the final results. Bidding strategy is exceptionally important because:
The right bidding strategy may help you a lot and increase your results by dozens of percentage points.
Lots of things may go wrong if you don’t have enough data or choose the wrong goal. That’s why a safe environment like the AB test is useful.
It’s hard to test it in any other way, it’s a native Google Ads setting and you can test it in Google Ads only.
First, you need to create a campaign draft which is simply a duplicate campaign that will become your experiment version and the original campaign will be your control version.
Log in to your Google Ads account.
Click “Drafts & experiments”, then click “Campaign Drafts”, and then a plus button.
Select a campaign, choose a draft name, and click “Save”.
Now your draft is ready and you can make your changes. When you’ll be ready you need to turn your draft into an experiment. To do that:
Log in to your Google Ads account.
Click “Drafts & experiments”, then click “Campaign Experiments”, and then a plus button.
Select the draft you’ve created, choose an experiment name, and choose a start date.
Enter the percentage of the original campaign’s budget you’d like to use in your experiment. Usually, it’s going to be 50%, if you’d like to start with a more safe approach you can try with less.
Decide between Cookie-based and Search-based traffic split. If you choose a Cookie-based split, a user will be treated the same version all the time. In a Search-based split, if a user will see the campaign a few times, he can be in different segments every time. Cookie-based split is usually better if you change something visually like a different landing page because it provides a consistent experience for users every time. If you test a bidding strategy you can use a search-based split because your users won’t see the difference and you’ll get results faster this way.
Save your experiment and wait for the results.
And that’s it. The best part is: Google Ads has a built-in calculator which includes a statistical significance and all the complicated calculations so you don’t have to worry about it and the tool will tell you when some variant may be declared a winner.
How to test with Google Optimize
Google Optimize can help you to build, run, and measure AB tests on your website. It’s a little bit more complicated because you need to install it first but it has more tools like a visual page builder. To start:
Create an account and container on optimize.google.com.
In your new account go to “Menu” → “Accounts” and link your container with Google Analytics.
Install Google Optimize snippet to your website. If you use Google Tag Manager, you can do it via GTM. Here’s the official instruction that should help you step by step: https://support.google.com/optimize/answer/7513085
A nice add-on Google Optimize has is the anti-flicker snippet. Sometimes when your page loads, before the experiment variant B is loaded, the user can see the original rendered website which then jumps and changes. Google prepared a separate piece of code that will prevent that. You can find all of the installation details on the page linked above.
How to prepare AB tests in Google Optimize?
Go to your Google Optimize account, click on your container name and click “Create Experiment”.
Enter the name, the URL of your “Editor page” (this is your original page, a control version), click “AB Test” and “Create”.
Click “Create variant”, enter the name and click “Add”.
Now you’re in the Google Optimize visual editor, you can click on any element you want to edit like headlines or buttons, use the editor to make changes, and save it when you’re done. You’ve just created a variant of your website inside Google Optimize.
If you have your variant already prepared because you did it manually or used an external tool and you want to use Google Optimize only for running your experiment, you can do it too. Prepare an URL of your experiment page and in step 2 instead of “AB Test”, choose “Redirect Test” the other steps are similar.
How to configure AB tests in Google Optimize?
When you have your variants ready you’ll be in the configuration card.
Select Google Analytics view and select objective. This will be the success (or conversion) of your test.
Similar to Google Ads, select how many users you want to include in your experiment. The most popular option with 2 variants is 50:50.
Decide when your experiment is shown, usually you want to put your editorial page URL.
Run your test and wait for the results.
There are a few more things to remember. Your experiment will run until one of your variants will have a 95% probability of beating the second. Also, in your reports, you will see a modeled conversion rate chart. Why “modeled” conversion rate? And how is it different from the real conversion rate? It is a conversion rate you can expect in the long run optimized by factors like day of the week and other signals to simulate the real outcome.
In other words: If you have started your test on Monday and you check results on Thursday but Google knows you can expect a lower conversion rate during weekends, your modeled conversion rate will be decreased to include this weekend factor which we can expect.
Common mistakes
Please remember, there are lots of more factors and nuances in AB testing. This article covers the most important areas from a practical point of view. If you would like to talk to an analyst and testing consultant to create a real testing culture and processes in your business, contact us and we’ll match you with an expert.
As a bonus, here are some common mistakes to avoid:
Testing with a too-small sample of users/conversions.
Testing without a real research-based hypothesis behind.
Making too small changes.
Blindly following AB tests best practices.
Ending your tests too soon.
Giving up AB testing after the first fail.
Testing too many things simultaneously.
Not sharing your learnings with the rest of the team.
Lowering a required confidence level AFTER results.
Ignoring results when they are not aligned with your intuition.
The last two are really important. We all want our tests to be successful. And when you really really want to succeed and you look at your data for long enough, there’s a 100% percent of probability you’ll find a way to make it look like a win even if it’s not.
I wish you high conversion rates and successful testing.
Read more: